
The outbreak of the Coronavirus has been the single largest disruption to the freight forwarding market for decades. Lockdowns imposed by governments have resulted in the plummetting of airfreight capacity as passenger travel halted whilst ship sailings were cancelled around the world as trade fell.
These monthly graphs illustrate the impact Coronavirus has had on both the air freight and the sea freight market.
Air Freight Volumes
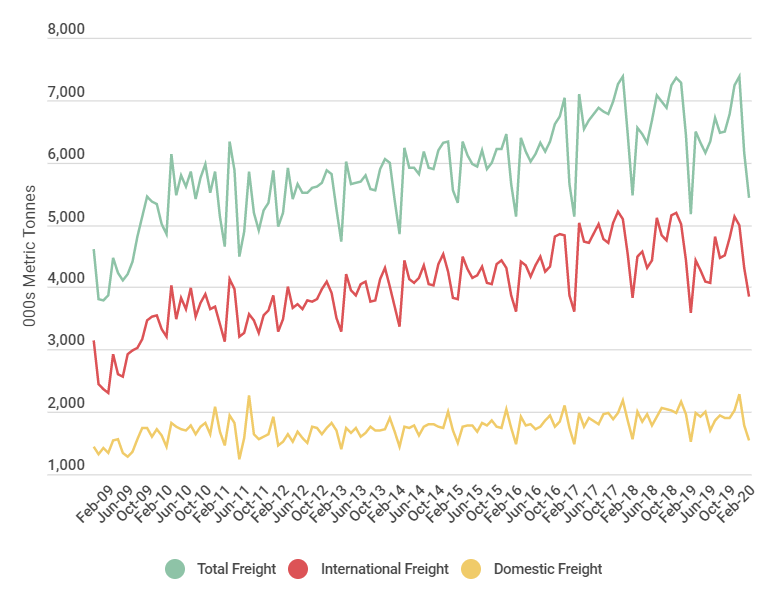
Air Cargo: Global
Source: ACI/Ti Dashboard
The ‘Air Cargo: Global’ graph is sourced from Airports International Council (ACI) and measures the monthly number of metric tonnes of freight transported internationally and domestically.
The most recent data is for February 2020 where the graph demonstrates the domestic freight market suffered most, declining by -9.1%, driven by a significant downward shift in Asia Pacific. The international freight market grew 0.4%. The 12-month rolling average showed the international segment fell by -3.8%.
All three measures have shown a steep decline in the first two months of 2020; however, this does not look unusual, yet. There are often troughs of volume especially in the first quarter of a year, but the context around this is telling another story.
As of Mid-May, it was estimated that international air cargo capacity was 28% lower than the same week in 2019 whilst global widebody belly capacity remained 75% below levels in 2019 but at the same time global freighter capacity was 13-19% higher over the same period. Passenger flights on average carry 55% of all goods sent by air, indicating the industry is too reliant on belly hold cargo. This is known across the industry but only really comes to light in a crisis for example in the event of a natural disaster, terrorist attack or in this case a pandemic.
The capacity issue has led to a rise in rates. In March 2020, the lack of capacity due to passenger flight cancelled mean the rates were three times the price. By May, the price increased to 70 yuan ($9.87) to send 1kg from Shanghai to the US or Europe, more than four times the pre-coronavirus fare.
Sea Freight Volumes
US: Ports
Source: Various ports/Ti Dashboard
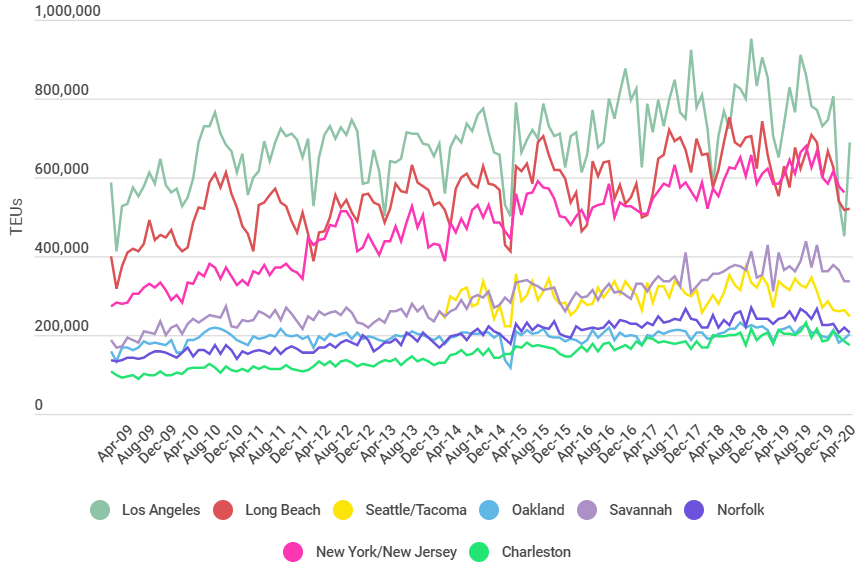
The US graph combines both east and west coast ports and shows container throughput by the number of TEUs handled by the major US ports each month.
In the most recent month’s data, all eight ports handled decreased volumes year-on-year.
In April 2020, at Charleston volumes fell by -13.9%, in Savannah volume growth declined by -7.3% whilst in Norfolk, volumes decreases were higher at -15.7%. Los Angeles volumes decreased by -6.5% and at Oakland the figure was the same. Long Beach port saw volumes down by -17.3% year-on-year and at Seattle/Tacoma volumes fell the most, -23.5% compared to the same month in 2019. In March 2020, New York/New Jersey recorded volumes decreased by -4.1%.
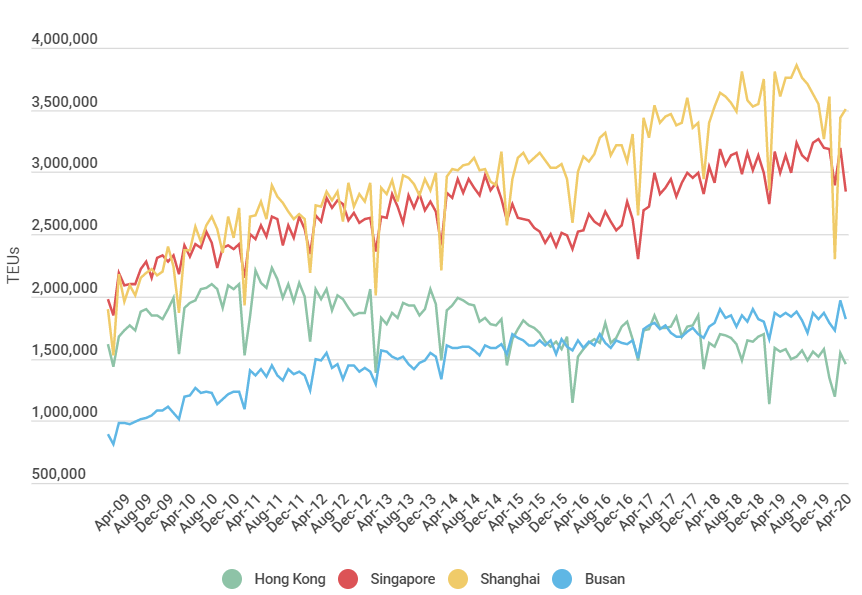
These are quite substantial figures with the sharpest quantity fall seen at Los Angeles, with over 350,000 TEUs less in March than in February 2020. The American ports handle significantly less than Asian ports as can be seen in the graph ‘Asia: Ports’. Shanghai already looks to be recovering from the impact that Coronavirus had on its throughput at the start of the year.
Asia: Ports
Source: Various ports/Ti Dashboard
The graph shows container throughput by the number of TEUs handled by four major Asian ports each month.
In April 2020, in Hong Kong, volumes were -7.3% lower year-on-year, whilst Singapore registered an increase of 5.0% in containers. Busan volumes decreased by -1.0% year-over-year for April 2020, whilst Shanghai port registered a year-over-year decrease of -2.9% for the same month. The most eye-catching point on the graph is Shanghai’s plunge in early 2020. It represents 1.3m TEUs less were handled at Shanghai between January and February this year, the sharpest drop month on month.
As expected, these monthly graphs show some steep volume decreases for ports in the US and Asia. What is interesting to note is the sharp decline and fast recovery for the largest regional ports; Los Angles and Shanghai, but then how some of the smaller ports are still experiencing declines. After the virus shutdown much of Asia, it caught up with Europe and US causing manufacturing and industry closures, halting production, and exports; this decent can be seen in February to March. However, by April a recovery in volumes at the largest ports is visible. The volumes at the smaller US ports are continuing on a downward trajectory, with only a few showing signs of marginal increases on the previous month. This cannot be said for Asian ports, although there was a pickup in March the volumes have dropped off again for April. This may be due to lead times on shipped cargo or delayed impacts on trade but most likely the global lack of demand and supply.
The Ti Dashboard has captured data that shows how volumes have been affected by the Coronavirus pandemic for the first four months of the year. It is interesting to see the data over time and how it varies. And more crucially how, despite the chaos, the pandemic freight continues to move and despite lockdowns and quarantine recovery of appears swift, for some. The true extent of the impacts will not be truly visible for some time due to data release and course of the pandemic. It is not currently a catastrophic sight but the magnitude of damage to global trade and economy will only take shape later down the line.
Source: Transport Intelligence, June 2, 2020
Author: Holly Stewart
The Ti Dashboard is a collection of global and regional transportation, trade and economic data, which includes key metrics regarding the air freight and forwarding markets. The Ti Dashboard provides the facts you need in one easy to use source, saving you time, with insight and analysis from industry experts that enable you to make informed decisions. For more information, click here.