To follow up last month’s Chart of the Month brief which analysed real retail sales growth across a range of markets, this month’s iteration in much the same vein takes a look at manufacturing sector growth.
Firstly, it is worth clarifying how such ‘high-level’ figures offer insight into how well the logistics sector performed. It is easy to comprehend that as the manufacturing sector grows, demand for transport and logistics services from that sector grows. But by how much?
First, consider what the ‘manufacturing logistics’ market is. It is simply the sum of the logistics costs of all manufacturers. That is some proportion of total manufacturing sector revenues. Now consider a scenario whereby that proportion does not change year-on-year. Then by definition, manufacturing sector growth will equal manufacturing logistics sector growth. In reality, that proportion does change year on-year, so it is more worthwhile to think about where that change is likely to be small, such that the headline manufacturing growth numbers tell us something meaningful about growth in manufacturing logistics. Intuitively, it seems likely that there would be far more ‘action’ in emerging markets rather than more mature, developed markets, where one might expect logistics costs as a proportion of sales to be more consistent over time, although of course that should be taken as a generalisation at a very high-level.
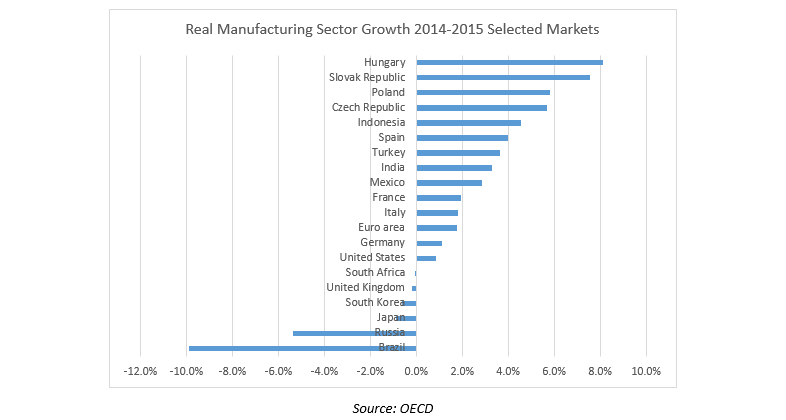
With that in mind, a look at real manufacturing growth rates across various countries in 2015 reveals that Central and Eastern Europe (CEE) was very much top of the pile. Growth in Hungary, Slovakia, Poland and Czech Republic was better than in the likes of Indonesia, Turkey, India and Mexico. Unsurprisingly, recession-hit Russia and Brazil languished at the bottom. Among major Western European economies, Spain, France and Italy were the best-performing, although this is not much to celebrate (as the second graph below demonstrates). The German and US growth figures were anaemic at just 1%, while the UK and Japan endured slight contractions.
It is important however to put these figures into context. The graph below measures how much larger the same markets were at the end of 2015 compared to 2008 (the pre-recession peak year for most markets), offering up a markedly different picture. Although Poland and Slovakia are still at the top of the league, Hungary and Czech Republic are now middle of the pack. Despite having a very poor year in 2015, Russia’s manufacturing sector was still larger at the end of 2015 than it was in 2008, although that may not be the case by the end of 2016. In general, manufacturing in developed countries in real terms is still smaller than it was in 2008. Austerity Europe has suffered the worst: Italy and Spain’s manufacturing sectors were still almost 20% smaller at the end of 2015 compared to 2008. That Brazil’s position is worse than France’s illustrates the scale of the mess it is in.
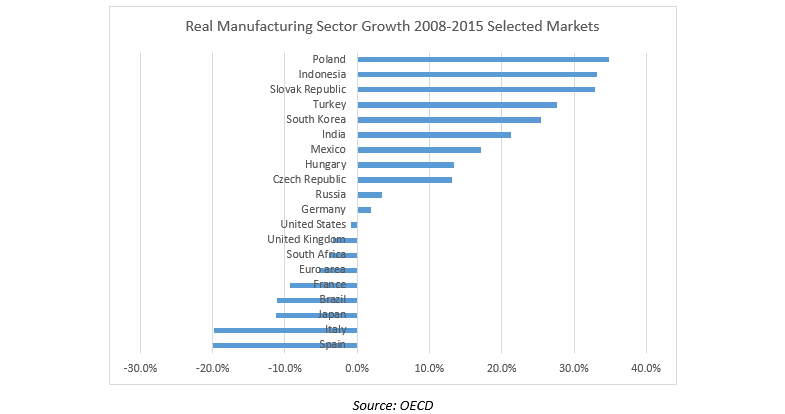
Overall, this analysis shows that it is important not to tarnish all of Europe with the same brush. CEE’s manufacturing growth since 2008 is a world apart from Western Europe’s performance, even beating out the likes of Indonesia and India.
Data for Ti’s Chart of the Month is taken from the Ti Dashboard, an interactive charting tool providing data and analysis across the transport and logistics industry. Further information regarding this product can be found here: http://www.ti-insight.com/dashboard/
Source: Transport Intelligence, 4th May 2016
Author: David Buckby