Ti is frequently asked to analyse markets on a vertical sector basis, with the question usually being either how large or how fast a certain sector is growing with reference to a specific logistics market.
As part of our upcoming report, Global Contract Logistics 2016, we are investigating the size of the global contract logistics market by vertical sector. Moreover, we are also attempting to shine a light on the speed of growth in two of contract logistics’ most important verticals: retail and automotive.
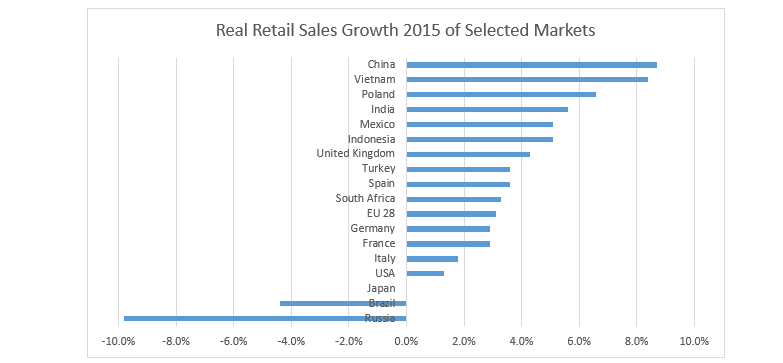
Taking a deeper look at the retail market, our initial findings suggest that the consumer/ retail sector accounts for approximately half of global contract logistics revenues. And using real retail sales growth figures as an indicator of the performance of retail contract logistics, it appears that in 2015, major European markets have done relatively well, the US relatively poorly, Asia Pacific’s figures held up well while Brazil and especially Russia suffered badly.
An immediate question that arises is how useful are high-level retail sales figures in assessing the performance of a country’s retail contract logistics market? Firstly, all else equal, the larger a country’s retail sales, the larger its retail contract logistics market. Similarly, the higher its retail sales growth, the higher its retail contract logistics growth. In reality however, there are other important variables to consider: the extent of modern/ formal retail penetration in a country, the value of logistics costs as a % of sales for retailers and the extent of logistics outsourcing to name a few. It follows that the usefulness of retail sales data alone is limited. That said, imagine a scenario whereby retail sales growth equals retail contract logistics growth because the formal retail penetration rate, logistics costs as a % of sales and the outsourcing rate do not change year-on-year. In certain developed markets, this scenario may not be too far from reality. In emerging markets, this is far less likely.
With these caveats in mind, the graphs below suggest that China and Vietnam had the best growth rates in 2015, with Poland outperforming a number of far less mature emerging markets like India and Indonesia. The UK also performed strongly, comfortably outpacing growth in Germany, France and the EU as a whole. The US was near the bottom of the list, with only Japan (long term stagnation), Brazil (in recession) and Russia (in recession) worse.
Looking at growth over a longer time horizon (2010-2015 CAGR), China and Vietnam are still top of the pile, and unsurprisingly emerging markets alone fill out the top eight spots. The US is much higher up while austerity Europe languishes near the bottom. Overall, the figures are likely to be highly instructive when assessing the performance of retail contract logistics in developed markets, useful to an extent in markets with somewhat mature retail sectors like South Africa and China, but virtually useless in the case of markets such as India, where informal retail really dominates.

Notes: All European data is from Eurostat, except Spain data (not available on Eurostat) which is from the OECD. All Asia Pacific data is from a February 2015 PwC report ‘2015-16 Outlook for the Retail and Consumer Products Sector in Asia’, with the figures (which are forecasts) produced by the Economist Intelligence Unit. Data for all other countries is from the OECD.
To register your interest for the upcoming Global Contract Logistics 2016 report please contact Michael Clover directly: [email protected]
Data for Ti’s Chart of the Month is taken from the Ti Dashboard, an interactive charting tool providing data and analysis across the transport and logistics industry. Further information regarding this product can be found here: http://www.ti-insight.com/dashboard/