There is a clear and long-established link between GDP growth and transport and logistics sector growth. In general, the higher economic growth, the stronger growth is in transport and logistics. The rationale is simple – higher economic output is associated with higher consumption and production, which stimulates greater demand for freight transport services. Simply, to understand the impact of Brexit on logistics, part of that puzzle is to understand the economics.
In the run-up to Brexit, a strange thing happened. Economists almost universally agreed on something. That is, they came basically as close to a consensus as is possible (for economists anyway) that the long-run effect of Brexit on UK GDP would be negative. At least, that is what is indicated by survey evidence, and various economists commenting on the issue here, here, here and no doubt elsewhere.
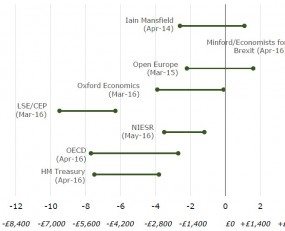
Now for a caveat. Economists may have agreed on the direction of travel, but there is not really a consensus on the scale of the impact. So what exactly are the numbers? The chart below does a good job of outlining the various predictions on offer.
Estimates of the long-term impact of leaving the EU on UK GDP
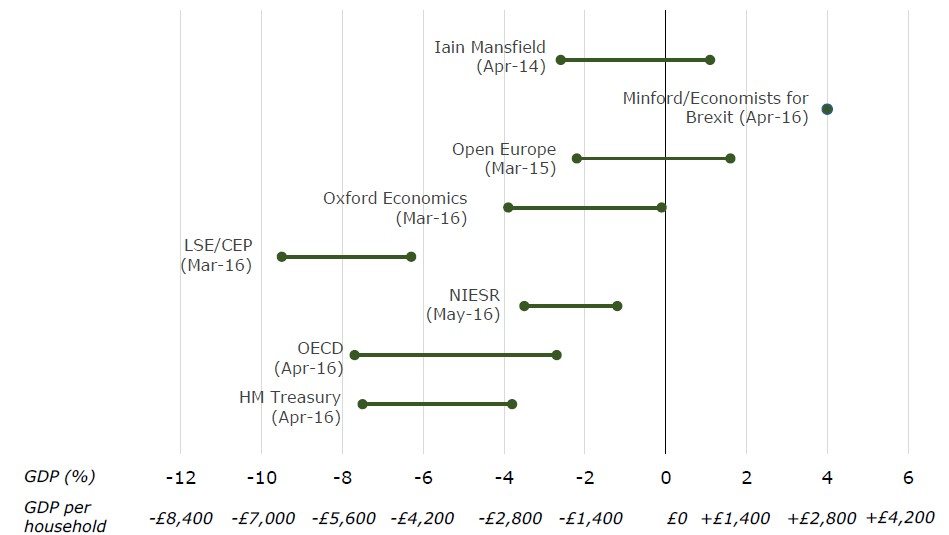
Source: Treasury Committee report
The only forecast fully tilted to the positive was that of Economists for Brexit, although a minority range of Iain Mansfield’s and Open Europe’s forecasts were also positive. All the rest were negative. Again, it is worth stressing that most economists just do not envisage a long-run positive impact on GDP happening.
Why do the forecasts differ? As the Treasury Committee report containing the chart states, “These [various studies] produce different results principally because they model the effects of leaving on trade and investment in different ways. They make different assumptions about the UK’s future economic relationship with the EU and the rest of the world, and about the extent to which the Government would choose to alter the regulatory framework presently set by the EU.” In short, the economics largely depends on what happens to three things: trade, investment and regulations.
A final point worth raising is how big is 2%, 4% or 6% of GDP? It’s very hard to get across just how significant these numbers are. One way of doing that is to put the figures in terms of GDP per household, as the chart does above. Another is to recognise that the UK’s long-run trend economic growth rate post-WW2 up until the financial crisis was 2.25%. Then put any GDP growth number into context against that. Or alternatively, you can take the words of economist Paul Krugman, “2% is a lot! It’s very, very hard to come up with policies that will make a country 2% richer in perpetuity. You’d have to have very good reasons to leave the EU to be willing to make that big a sacrifice.”
Source: Transport Intelligence, July 4th, 2016
Author: David Buckby