The Ti Dashboard displays sea freight rates across a number of routes. Over the last year, rates have reached unprecedented heights.
The increase from May last year looks to have created a new normal. Though rate fluctuation is not uncommon, the graphs below show just how exceptional the current prices are. Equipment shortages and the reduction of vessel capacity have been some of the factors causing these rate rises
By November, headlines were screaming about “explosions” in freight rates exacerbated by a shortage of containers and port space. It became clear the largest source of the problem was continuing asymmetric demand across the Pacific. The West Coast ports in North America have been experiencing double-digit percentage rate increases in imports, especially from China. Demand then also washed into the East Coast ports which saw huge leaps in traffic. American agricultural exporters in mid-Western states were complaining that they could not obtain containers as shipping lines are moving them out of the US as quickly as possible, largely returning them to China in order to pick up more consignments.
More recently, there has been a decline in rates on the Asia to US West Coast route. The previous high import demand from the US led to tight capacity pushing rates up. Subsequently, this caused congestion at the West Coast ports which increased costs for carriers who then kept prices high. However, now the congestion at the main ports of the region, LA and Long Beach has meant shipping lines have been working to reroute freight to alternative ports to avoid queues, going as far as the East Coast. As this continued into March, the issues were reflected in the weekly sea freight rates. in The week commencing March 8, the Freightos FBA Freight Pricing Index explained prices from Asia to the US East Coast fell by 6% while rates increased by 6% to the West Coast.
Demand for Chinese imports from the US is expected to remain high; according to the US National Retail Federation, retail import volumes are expected to increase by 23% over the first half of 2021, compared to 2020. This continuous demand means congestion at LA and Long Beach is unlikely to subside for some time. More and more carriers are being forced to divert and even cancel services on this route. It’s likely this will lead to a further fall in current extreme rates for the Asia to West Coast US route over the coming months, but see Asia to US East Coast rates increase.

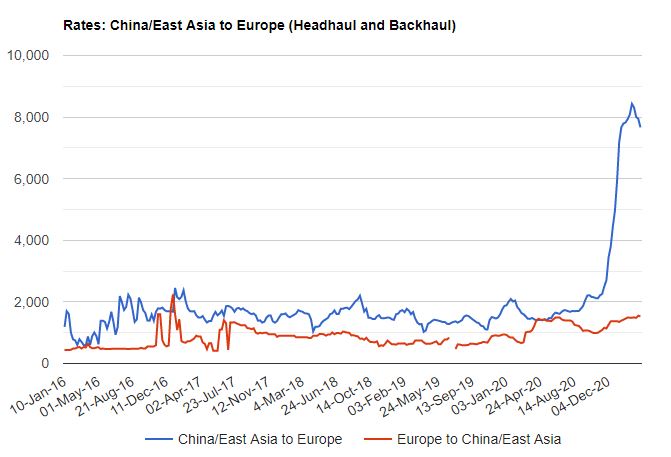
It is not only the Transpacific lanes that have seen an unprecedented rise in rates. The head haul lane from China/East Asia to Europe started to increase from June 2020 but the vast incline seen below began in November. Brexit and the pandemic have been blamed for the surge in prices. The spike in demand came in the weeks before Christmas and the UK’s departure from the EU. This led to the Port of Felixstowe being obstructed by thousands of containers holding PPE in demurrage. Ships were forced to divert to non-UK ports such as Rotterdam, Antwerp and Hamburg; aggravating rates and congestion caused by high import demand in the UK.
Over 2020, the Ti Dashboard recorded some of the highest sea freight rates from the Freightos Baltic Index. The pandemic has caused unbalanced demand on a global scale which has resulted in access problems at ports and a shortage of containers. In effect, this has depressed the capacity available, strongly affecting prices. With demand not expected to wane, but in fact grow, the problem of congestion looks set to stay. As for prices, whilst some routes are showing rates falling, it appears there is simply a transfer of these higher price trends to other alternative lanes.
Source: Transport Intelligence, March 23, 2021
Author: Holly Stewart
The graphs featured in the brief are Rates: China/East Asia to US West Coast (Headhaul and Backhaul) and Rates: China/East Asia to Europe (Headhaul and Backhaul) and can be found on the Sea Freight page of the Ti Dashboard.
The Ti Dashboard is a collection of global and regional transportation, trade and economic data, which includes key metrics regarding the air freight and forwarding markets. The Ti Dashboard provides the facts you need in one easy to use source, saving you time, with insight and analysis from industry experts that enable you to make informed decisions. For more information, click here.