
‘If you don’t measure your sustainability, how can you improve it?’ Professor John Manners-Bell
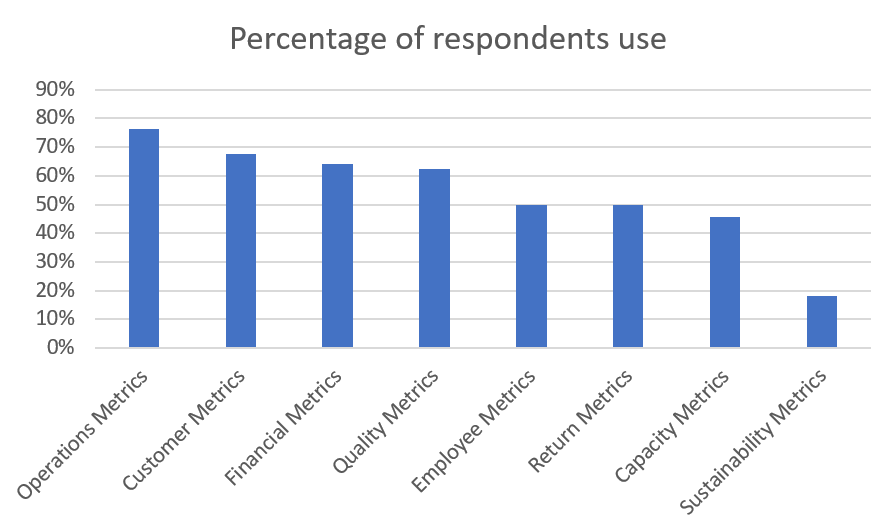
An exclusive survey undertaken by Ti in the last quarter of 2019 revealed that only a very small proportion of warehouse operators are presently using Sustainability Metrics to analyse their impact on the environment. The in-depth survey asked 38 logistics managers of leading retailers, manufacturers and 3PLs about their warehouse operations and the metrics they employed. Only 18% of those questioned said they used formal metrics to assess the sustainability of their warehouses.
Of those who did use Sustainability Metrics, not one was able to say how much energy they used per square metre or how much CO2 they produced at their warehouses.
The question formed part of Ti’s on-going Operational Benchmarking Survey which was launched in 2019. Respondents provided a range of data on their operations – from On-Time In-Full rates to the functionality of their warehouse management system.
Overall, the top three metrics most frequently used were ‘Operations’ (76%) followed by ‘Customer’ (68%) and ‘Financial’ Metrics (64%). (See notes for definitions). Surprisingly, only half of respondents said that they used ‘Employee’ metrics such as tracking workforce turnover or the number of temporary employees they hired. ‘Sustainability’, however, was by far the least used category.
According to Professor John Manners-Bell, Ti’s CEO, the results of the survey raise some difficult questions for warehouse operators: ‘All companies these days are quick to talk up their green credentials. However, it is worrying that so few have any systems in place to assess their environmental impact. If you don’t measure your sustainability, how can you improve it?’
Source: Transport Intelligence, January 28, 2020
Author: Transport Intelligence
About the Operational Benchmarking Survey:
Ti’s Operational Benchmarking Survey is an on-going study, designed to identify current and best practice in the warehousing sector. CLICK HERE to take part in the survey. Respondents will be provided with a summary of the results, showing how their performance measures up with the industry as a whole.
Examples of Metrics Categories
Operations Metrics (e.g. Dock-to-Stock Cycle Time; Fill rate; On-time Ready to Ship)
Customer Metrics (e.g. On Time in Full; Total Order Cycle Time; Internal Order Cycle Time)
Financial Metrics (e.g. Distribution Cost as a Percent of Turnover, Days of Stock, Months of Stock)
Quality Metrics (e.g. Inventory Count Accuracy by Location; Order-picking Accuracy; Order-packing Accuracy)
Employee Metrics (e.g. Annual Workforce Turnover; Part-time workforce to Total Workforce; Temporary employees to Total Workforce; Cross Trained Percentage)
Return Metrics (e.g. Rate of return)
Capacity Metrics (e.g. Average Warehouse Capacity Used; Honeycomb Percentage; Peak Warehouse Capacity Used)
Sustainability Metrics (e.g. Energy usage, CO2 usage)