
An important finding of Agility Emerging Markets Logistics Index 2017, produced by Ti on behalf of Agility, was that China’s trade volume growth prospects had been significantly watered-down by the IMF. A comparison of the IMF’s April 2015 predictions to its October 2016 set revealed that import and export volume growth CAGRs for 2015 to 2020 were both cut from in excess of 6% to just over 2%. It was stated: “With Factory Asia feeding China, this has very much put the brakes on emerging markets generally.”
While that statement broadly held true, it intuitively seemed odd that Vietnamese trade growth prospects remained so strong (in the double-digits) as China languished, given their interdependence and intertwined supply chains.
In the IMF’s latest iteration of its World Economic Outlook Database (April 2017), there have been some significant revisions to forecasts that warrant attention.
At first glance, this is not really evident, with growth prospects of real GDP, import and export growth relatively unchanged for the IMF’s aggregate grouping of emerging market and developing economies. The April 2017 data suggests that the 2016 to 2021 CAGRs for all the aforementioned macroeconomic growth measures are between 4% and 5%, which was also the case in the IMF’s October 2016 dataset. Figures for 2017 are also relatively stable.
This largely reflects consistency of forecasts in most of the largest emerging economies, particularly the BRIC economies, which although have lost relevance as a club of dynamic growth, remain the four largest emerging markets by GDP in nominal US dollars and purchasing power adjusted terms.
While GDP growth prospects for 2017 and beyond were relatively unchanged for most emerging markets, there were notable changes to trade volume growth forecasts which should concern freight forwarders exposed to such markets. The graphs below analyse the percentage point differences in IMF growth predictions for 2017 and 2016-2021 CAGRs made in their October 2016 and April 2017 World Economic Outlooks.
Percentage Point Differences in IMF Import Volume Growth Forecasts from October 2016 Outlook to April 2017 Outlook for Selected Emerging Markets
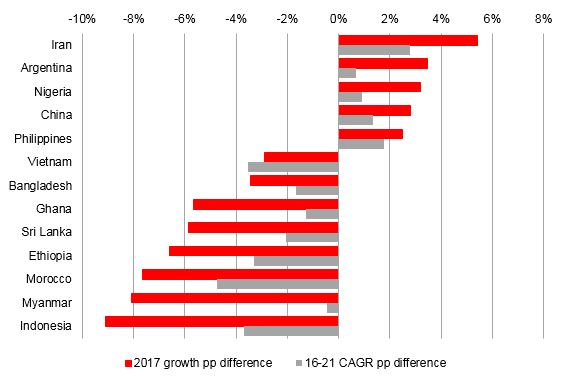
Source: Ti calculations, based on IMF data
For imports, Iran is the big winner, followed by Argentina as something of a ‘return to normalcy’ boosts import volumes. Encouragingly, China’s import volume growth is also on the up. Expectations for many markets have suffered though, with Morocco and Indonesia suffering significant downgrades for 2017 and further ahead.
Percentage Point Differences in IMF Export Volume Growth Forecasts from October 2016 Outlook to April 2017 Outlook for Selected Emerging Markets
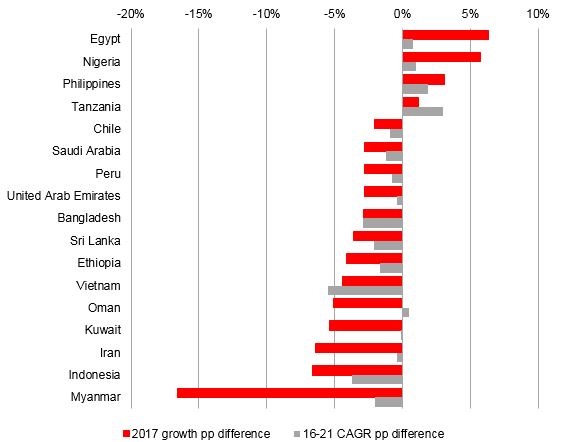
Source: Ti calculations, based on IMF data
As for exports, Egypt’s expectations for 2017 have vastly improved, though this is not really the case for further down the line, though the reverse is true for Tanzania. As for those suffering downgrades, many Middle Eastern markets (Saudi Arabia, UAE, Oman, Kuwait and Iran) feature in the list. As with imports, Indonesia has suffered substantial cuts, as has Myanmar, though only really for its 2017 growth number.
Although you could make a case for Indonesia, my pick for the biggest story in all these numbers is the downgrade of Vietnam, which has been a trade growth darling, enjoying double-digit import and export volume growth in each of the last five years. However both its import and export volume growth figures for 2017 and its 16-21 CAGRs have been slashed. In this latest set of forecasts, it has the black mark of being the only country whose downgrade in its 16-21 CAGRs outstrips the percentage point reduction in its 2017 growth figures. Not only has the IMF moderated its expectations for 2017, but also significantly watered-down its medium term prospects too, something it clearly does not do very often as the rest of the figures on the graph illustrate. It is worth noting that its import and export volume growth CAGRs for 2016 to 2021 are 8.7% and 7.5% respectively, still robust, but not the double-digit growth that has come to be expected.
While trade growth data and forecasts in particular need to be interpreted carefully and certainly not relied on for complete accuracy, buried deep in the numbers are often one or two stark signals that should be taken heed of. On this occasion, the main warning sign appears to be Vietnam getting similar treatment to what China’s trade prospects suffered not so long ago.
Source: Transport Intelligence, May 4, 2017
Author: David Buckby