About a month ago, it was revealed that Japan’s three major container lines, MOL, NYK and K Line would merge. Hapag-Lloyd has also recently been granted permission by the EU to merge with UASC, provided that the latter withdraws from North Atlantic trades. And the latest story in the container shipping consolidation saga is that Maersk are being linked with the acquisition of Hamburg Sud. As such, it seems a good time to take stock of just how much the sector has changed.
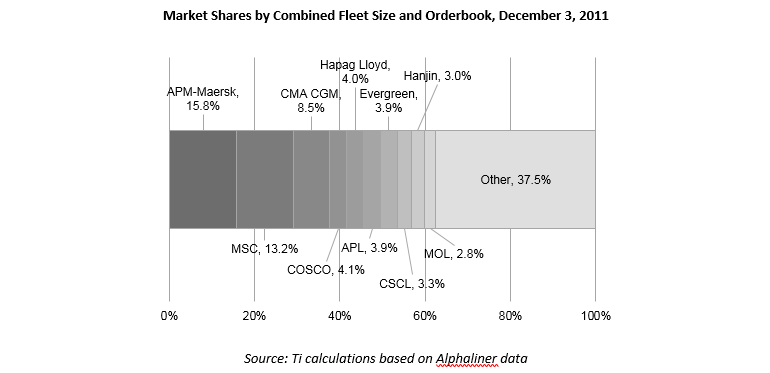
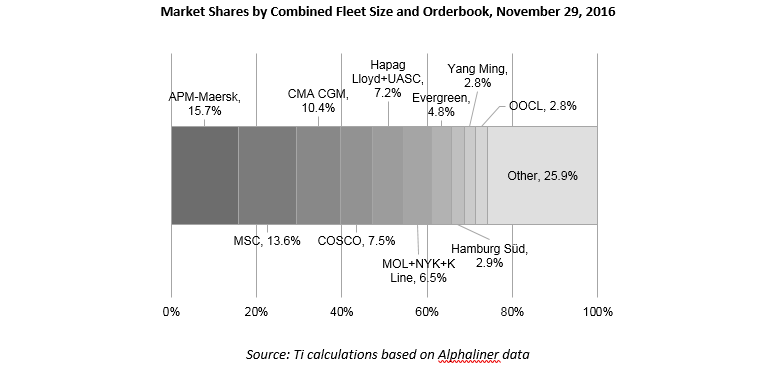
Going back a decade or so to 2005, shipping consultancy Drewry asserts that the top five carriers controlled around 36% of the market. According to Ti calculations based on Alphaliner data, on December 3, 2011, that share stood at 45.6%, while on November 29, 2016, the share was 54.4%, if you count Hapag-Lloyd and UASC as a single entity and merge the three Japanese lines.
Effectively, Alphaliner suggests that the number of global carriers (defined as operating in three or more continents) will have fallen from 20 at the beginning of 2016, to 14 by 2018, when the aforementioned transactions will have been completed. And if Maersk does indeed acquire Hamburg Sud, that number will reduce to 13.
A quick comparison of the names and shares in the charts above shows just how much consolidation and change has taken place. At the top, Maersk and MSC have remained pretty constant, but that may soon change. CMA CGM has absorbed APL in the period, who were themselves the 6th largest operator five years ago. In a similar vein, COSCO has tied up with China Shipping (CSCL), who were the 8th largest operator five years ago. Both CSAV and UASC are now under the umbrella of Hapag-Lloyd, which has seen its share rise from 4.0% to 7.2%. The merger of the three Japanese lines sees them take sixth place with a share of 6.5%. The other major development is that Hanjin of course has disappeared from the top 10.
The economics clearly dictate that the story has a good distance to run. Who knows whether the next five years will see more or less change than the previous five?

Source: Transport Intelligence, November 29, 2016
Author: David Buckby