The automotive industry was an early casualty of the Coronavirus pandemic, with many plants forced to shut down in early March. The industry was then hit by nationwide lockdowns which forced showrooms and dealerships to close. Data captured by the Ti Dashboard from the European Automobile Manufacturers’ Association (ACEA) demonstrates how lockdowns throughout Europe impacted car registrations in the region for the first six months of 2020.
Automotive: Car Registrations Europe
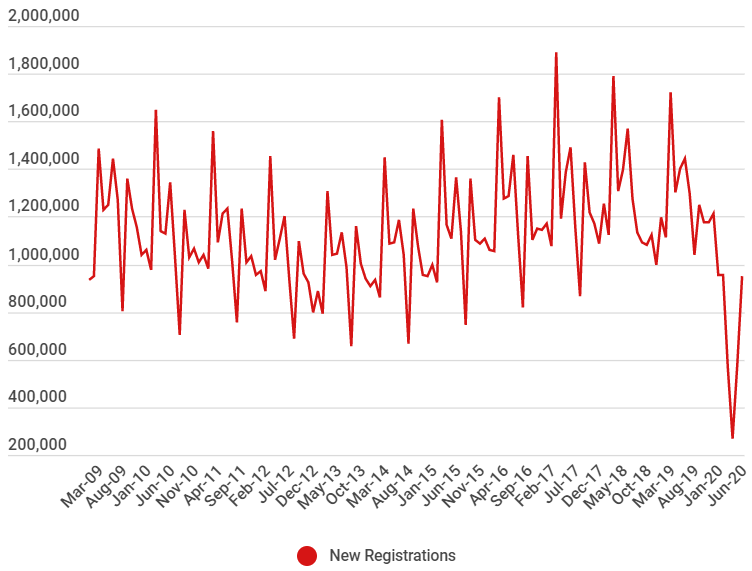
Source: ACEA/ Ti Dashboard
The ‘Automotive: Car Registrations Europe’ graph is sourced from the ACEA and tracks the number of new car registrations across Europe each month.
Even before the Coronavirus outbreak, car registrations throughout Europe had already begun to steadily decline. January and February both experienced year-on-year decreases of 7.5% and 7.4%, respectively. The drop in car registrations during the first two months of the year was due to a combination of factors including major taxation changes in some EU states which brought registrations forward to December 2019, weakening global economic conditions and consumer uncertainty.
In March 2020, the Coronavirus pandemic began to take hold on the European market, by the third week of March the vast majority of European dealerships had closed and most of Europe had entered into lockdown. Consequently, demand across the region for new cars fell and the EU passenger market recorded a dramatic year-on-year drop of 55.1% in registrations of new vehicles. By April, following a full month of lockdown restrictions in place, new passenger car registrations in the EU declined by 76.3% year-on-year, the steepest monthly drop in car demand since records began.
The most recent data captured by the Ti Dashboard is for June 2020. In June, registrations of new passenger cars in the EU totalled 949,722 units, a drop of 22.3% year-on-year. During the first six months of 2020, EU demand for new passenger cars contracted by 38.1% due to four consecutive months of acute declines across the region. However, it is not all doom and gloom and there are some bright spots for the market as lockdown restrictions have eased. The decline in June shows a slight improvement in comparison to a drop of 52.3% in May. Additionally, electric vehicle sales have continued to grow throughout the pandemic. Both full battery electric vehicles and plug-in hybrid electric vehicles have gained market share.
At the height of the crisis, automotive production lines came to a complete halt, with car sales collapsing throughout the region. If the market is unlikely to experience a swift recovery the logistics industry will also be impacted, particularly contract logistics and road freight providers. Providers may need to alter their operations and become more flexible in order to target other sectors such as e-commerce or pharmaceutical and healthcare to reduce their reliance on the automotive sector.
The Ti Dashboard has captured data that shows how car registrations in Europe have been affected by the Coronavirus pandemic for the first half of 2020. Despite some bright spots in the market, it is becoming increasingly unlikely that car sales and registrations will fully recover by the end of 2020. Many dealerships may have been hopeful that once restrictions were eased and showrooms could reopen, sales in the second half of the year would be driven by pent-up demand. However, this has not been the case as the Coronavirus pandemic and subsequent nationwide lockdowns have escalated an economic recession throughout Europe. It will be interesting to see if there is a second wave of lockdowns if it will have the same impact on car sales and new vehicle registrations or whether a second wave would have a more severe impact on the market.
Source: Transport Intelligence, August 27, 2020
Author: Beth Poole
The Ti Dashboard is a collection of global and regional transportation, trade and economic data, which includes key metrics regarding the air freight and forwarding markets. The Ti Dashboard provides the facts you need in one easy to use source, saving you time, with insight and analysis from industry experts that enable you to make informed decisions. For more information, click here.